Hystrix-dashboard是一款针对Hystrix进行实时监控的工具,通过Hystrix Dashboard我们可以在直观地看到各Hystrix Command的请求响应时间, 请求成功率等数据。但是只使用Hystrix Dashboard的话, 你只能看到单个应用内的服务信息, 这明显不够. 我们需要一个工具能让我们汇总系统内多个服务的数据并显示到Hystrix Dashboard上, 这个工具就是Turbine.
Hystrix Dashboard
我们在熔断示例项目spring-cloud-consumer-hystrix的基础上更改,重新命名为:spring-cloud-consumer-hystrix-dashboard。
1、添加依赖
<dependency>
	<groupId>org.springframework.cloud</groupId>
	<artifactId>spring-cloud-starter-hystrix</artifactId>
</dependency>
<dependency>
	<groupId>org.springframework.cloud</groupId>
	<artifactId>spring-cloud-starter-hystrix-dashboard</artifactId>
</dependency>
<dependency>
	<groupId>org.springframework.boot</groupId>
	<artifactId>spring-boot-starter-actuator</artifactId>
</dependency>
这三个包必须添加
2、启动类
启动类添加启用Hystrix Dashboard和熔断器
@SpringBootApplication
@EnableDiscoveryClient
@EnableFeignClients
@EnableHystrixDashboard
@EnableCircuitBreaker
public class ConsumerApplication {

	public static void main(String[] args) {
		SpringApplication.run(ConsumerApplication.class, args);
	}
}
3、测试
启动工程后访问 http://localhost:9001/hystrix,将会看到如下界面:
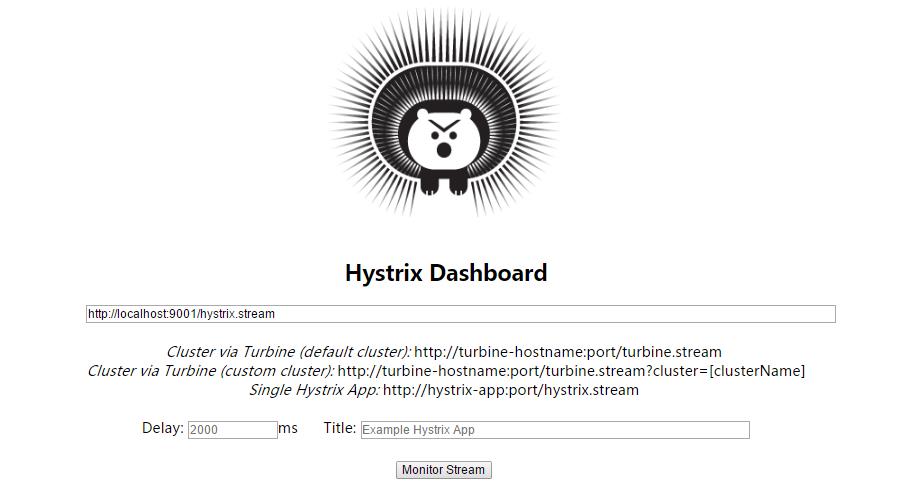
图中会有一些提示:
Cluster via Turbine (default cluster): http://turbine-hostname:port/turbine.stream
Cluster via Turbine (custom cluster): http://turbine-hostname:port/turbine.stream?cluster=[clusterName]
Single Hystrix App: http://hystrix-app:port/hystrix.stream
大概意思就是如果查看默认集群使用第一个url,查看指定集群使用第二个url,单个应用的监控使用最后一个,我们暂时只演示单个应用的所以在输入框中输入: http://localhost:9001/hystrix.stream ,输入之后点击 monitor,进入页面。
如果没有请求会先显示Loading ...,访问http://localhost:9001/hystrix.stream 也会不断的显示ping。
请求服务http://localhost:9001/hello/neo,就可以看到监控的效果了,首先访问http://localhost:9001/hystrix.stream,显示如下:
ping:

data: {"type":...}

data: {"type":...}
说明已经返回了监控的各项结果
到监控页面就会显示如下图:
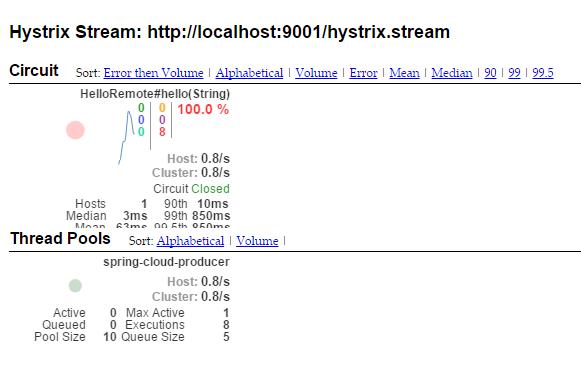
其实就是http://localhost:9001/hystrix.stream返回结果的图形化显示,Hystrix Dashboard Wiki上详细说明了图上每个指标的含义,如下图:

到此单个应用的熔断监控已经完成。
Turbine
在复杂的分布式系统中,相同服务的节点经常需要部署上百甚至上千个,很多时候,运维人员希望能够把相同服务的节点状态以一个整体集群的形式展现出来,这样可以更好的把握整个系统的状态。 为此,Netflix提供了一个开源项目(Turbine)来提供把多个hystrix.stream的内容聚合为一个数据源供Dashboard展示。
1、添加依赖
<dependencies>
	<dependency>
		<groupId>org.springframework.cloud</groupId>
		<artifactId>spring-cloud-starter-turbine</artifactId>
	</dependency>
	<dependency>
		<groupId>org.springframework.cloud</groupId>
		<artifactId>spring-cloud-netflix-turbine</artifactId>
	</dependency>
	<dependency>
		<groupId>org.springframework.boot</groupId>
		<artifactId>spring-boot-starter-actuator</artifactId>
	</dependency>
	<dependency>
		<groupId>org.springframework.cloud</groupId>
		<artifactId>spring-cloud-starter-hystrix-dashboard</artifactId>
	</dependency>
</dependencies>
2、配置文件
spring.application.name=hystrix-dashboard-turbine
server.port=8001
turbine.appConfig=node01,node02
turbine.aggregator.clusterConfig= default
turbine.clusterNameExpression= new String("default")

eureka.client.serviceUrl.defaultZone=http://localhost:8000/eureka/
turbine.appConfig:配置Eureka中的serviceId列表,表明监控哪些服务turbine.aggregator.clusterConfig:指定聚合哪些集群,多个使用”,”分割,默认为default。可使用http://.../turbine.stream?cluster={clusterConfig之一}访问turbine.clusterNameExpression: 1. clusterNameExpression指定集群名称,默认表达式appName;此时:turbine.aggregator.clusterConfig需要配置想要监控的应用名称;2. 当clusterNameExpression: default时,turbine.aggregator.clusterConfig可以不写,因为默认就是default;3. 当clusterNameExpression: metadata[‘cluster’]时,假设想要监控的应用配置了eureka.instance.metadata-map.cluster: ABC,则需要配置,同时turbine.aggregator.clusterConfig: ABC
3、启动类
启动类添加@EnableTurbine,激活对Turbine的支持
@SpringBootApplication
@EnableHystrixDashboard
@EnableTurbine
public class DashboardApplication {

	public static void main(String[] args) {
		SpringApplication.run(DashboardApplication.class, args);
	}

}
到此Turbine(hystrix-dashboard-turbine)配置完成
4、测试
在示例项目spring-cloud-consumer-hystrix基础上修改为两个服务的调用者spring-cloud-consumer-node1和spring-cloud-consumer-node2
spring-cloud-consumer-node1项目改动如下: application.properties文件内容
spring.application.name=node01
server.port=9001
feign.hystrix.enabled=true

eureka.client.serviceUrl.defaultZone=http://localhost:8000/eureka/
spring-cloud-consumer-node2项目改动如下: application.properties文件内容
spring.application.name=node02
server.port=9002
feign.hystrix.enabled=true

eureka.client.serviceUrl.defaultZone=http://localhost:8000/eureka/
HelloRemote类修改:
@FeignClient(name= "spring-cloud-producer2", fallback = HelloRemoteHystrix.class)
public interface HelloRemote {

    @RequestMapping(value = "/hello")
    public String hello2(@RequestParam(value = "name") String name);

}
对应的HelloRemoteHystrix和ConsumerController类跟随修改,具体查看代码
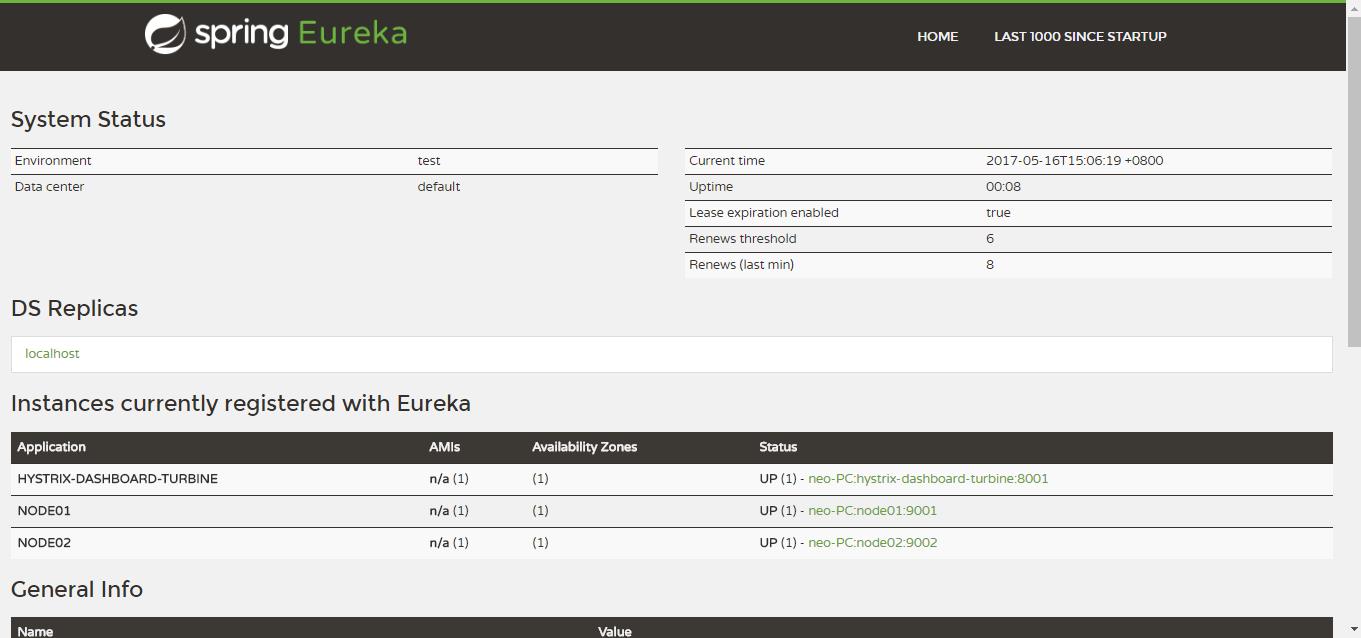
修改完毕后,依次启动spring-cloud-eureka、spring-cloud-consumer-node1、spring-cloud-consumer-node1、hystrix-dashboard-turbine(Turbine)
打开eureka后台可以看到注册了三个服务:
访问 http://localhost:8001/turbine.stream
返回:
: ping
data: {"reportingHostsLast10Seconds":1,"name":"meta","type":"meta","timestamp":1494921985839}
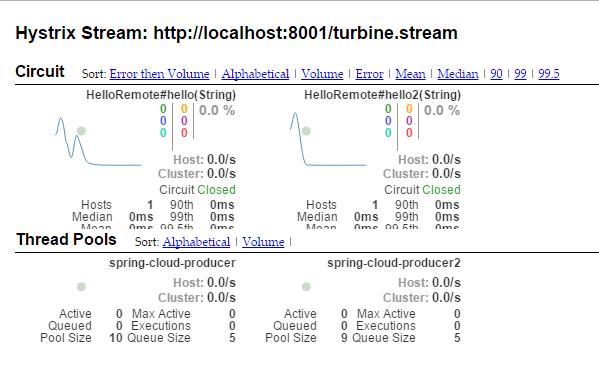
并且会不断刷新以获取实时的监控数据,说明和单个的监控类似,返回监控项目的信息。进行图形化监控查看,输入:http://localhost:8001/hystrix,返回酷酷的小熊界面,输入: http://localhost:8001/turbine.stream,然后点击 Monitor Stream ,可以看到出现了俩个监控列表
参考:
作者:纯洁的微笑
出处:http://www.ityouknow.com/
版权归作者所有,转载请注明出处

微信扫描二维码,关注一个有故事的程序员
(点击了解: 关于程序员的专属导航!)
Post Directory